Design SSRS Matrix Report
This section describes the steps to design yearly sales report of a company using SSRS matrix report item.
Create dataset
To present data in the matrix format, create a dataset and bind data to the matrix data region. In this designing section, the following dataset query is used for dataset creation.
SELECT PC.Name AS ProdCat, PS.Name AS SubCat, DATEPART(yy, SOH.OrderDate) AS OrderYear, 'Q' + DATENAME(qq, SOH.OrderDate) AS OrderQtr,SUM(SOD.UnitPrice * SOD.OrderQty) AS Sales
FROM Production.ProductSubcategory PS INNER JOIN
Sales.SalesOrderHeader SOH INNER JOIN
Sales.SalesOrderDetail SOD ON SOH.SalesOrderID = SOD.SalesOrderID INNER JOIN
Production.Product P ON SOD.ProductID = P.ProductID ON PS.ProductSubcategoryID = P.ProductSubcategoryID INNER JOIN
Production.ProductCategory PC ON PS.ProductCategoryID = PC.ProductCategoryID
WHERE (SOH.OrderDate BETWEEN '1/1/2002' AND '12/31/2003')
GROUP BY DATEPART(yy, SOH.OrderDate), PC.Name, PS.Name, 'Q' + DATENAME(qq, SOH.OrderDate), PS.ProductSubcategoryID
Refer Create Data section and create dataset using the above query.
AdventuresWorksdatabase is used here.
Add matrix to the report
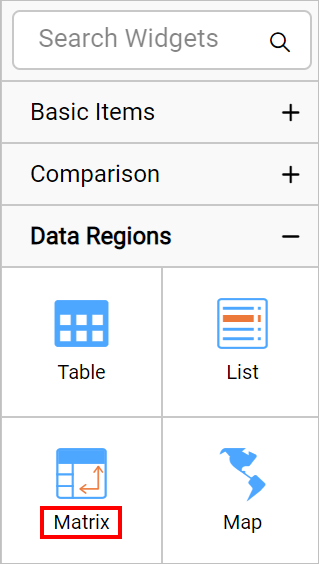
The matrix report item is listed in the item panel under the Data Regions category.
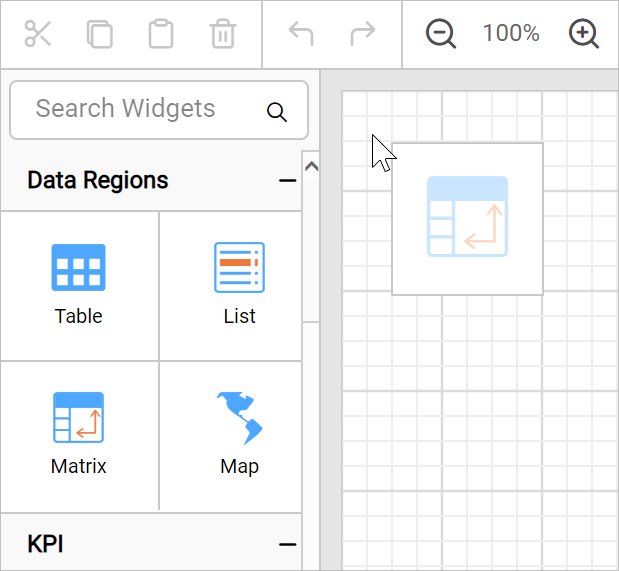
Drag and drop the matrix report item into the design area from the item panel. The properties of matrix report item will be listed in properties panel. By default, it will be named as Tablix1.
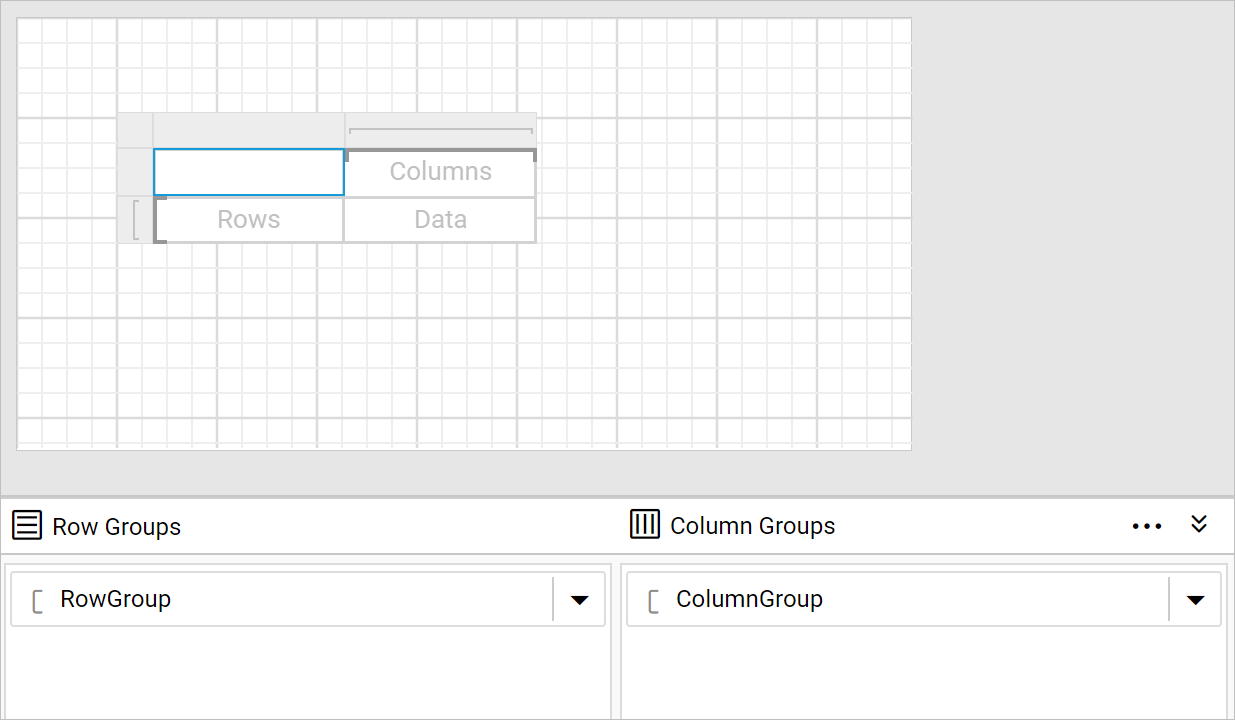
The matrix initially has empty default row group, column group and a data cell.
Assign data
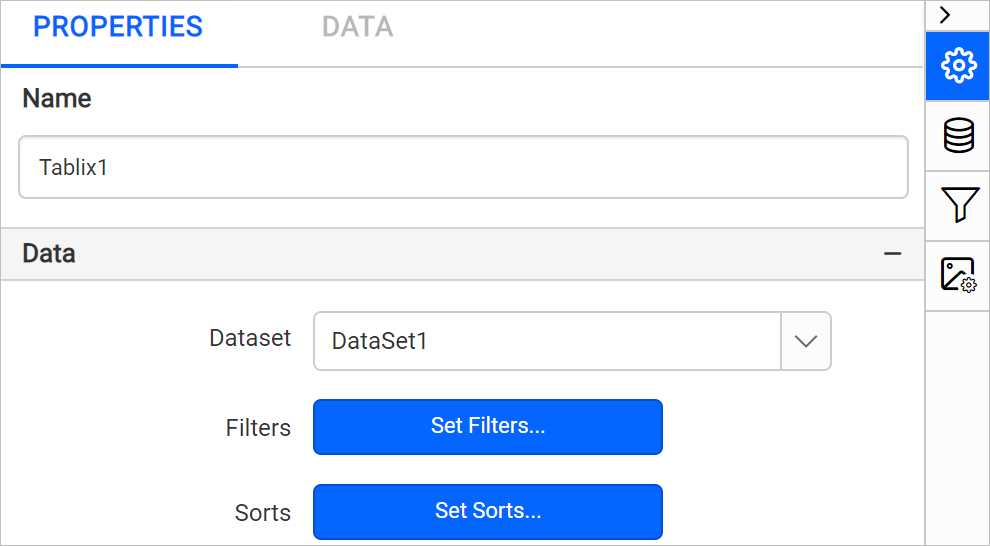
Assign dataset to the Dataset property of matrix report item.
Refer Assign fields section and assign the ProdCat, OrderYear and Sales fields in initial matrix design.
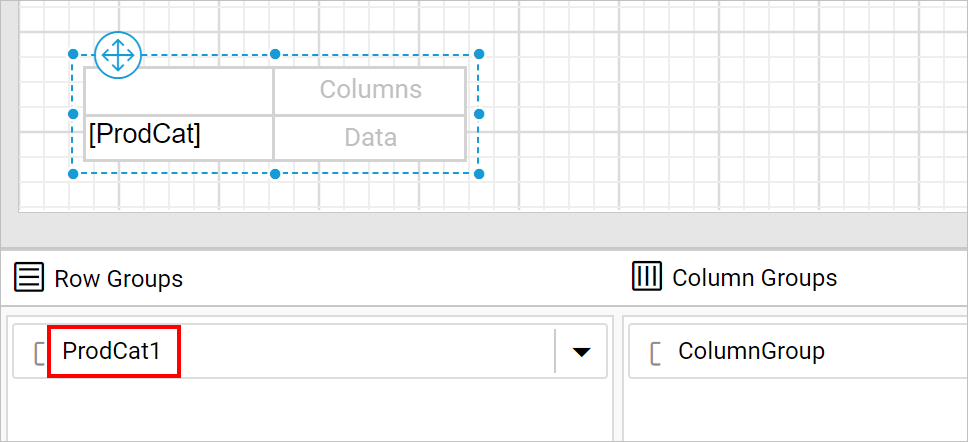
The first field that we assign to the row group or column group will replace the initial empty default row group or column group. Now, I have assigned ProdCat field in row group, notice the Row Grouping pane.
Delete details group
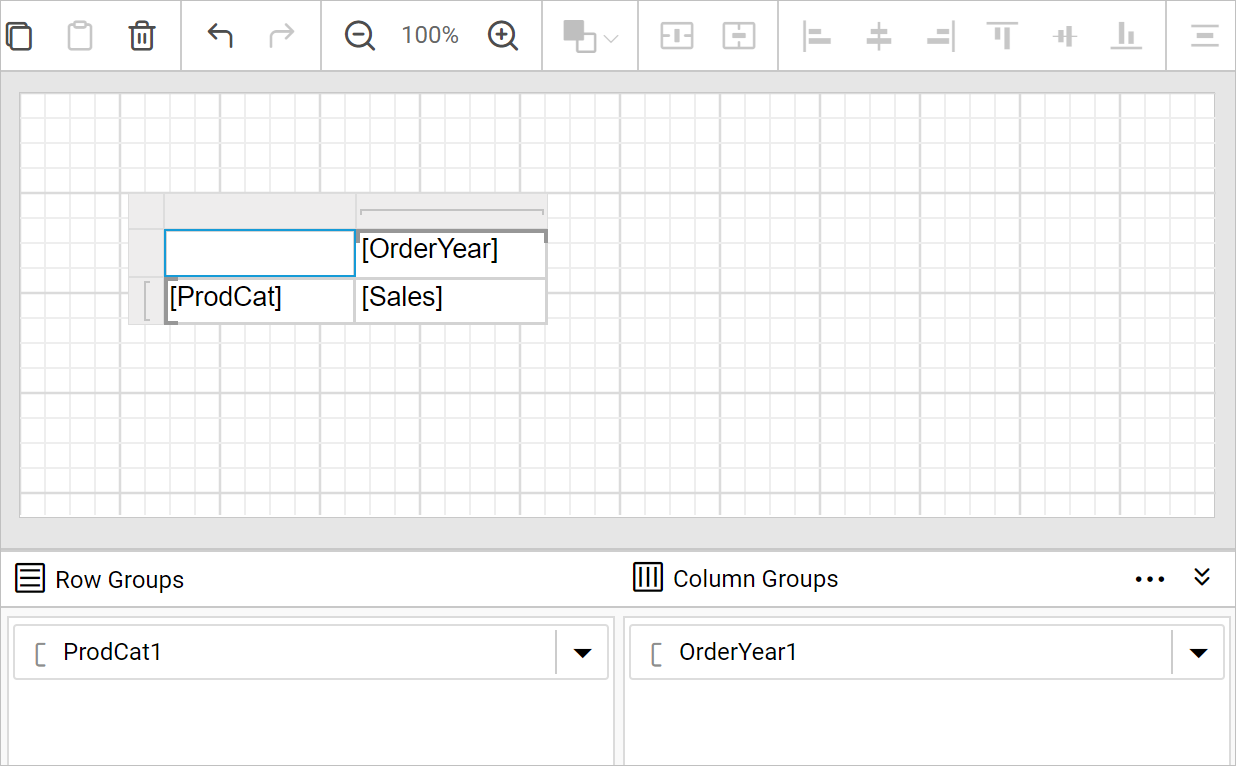
Similarly, assign OrderYear in column grouping pane and sales field in data cell.
Add child row group
- In the
Row Groupspane, open the group menu inProdCat1group field.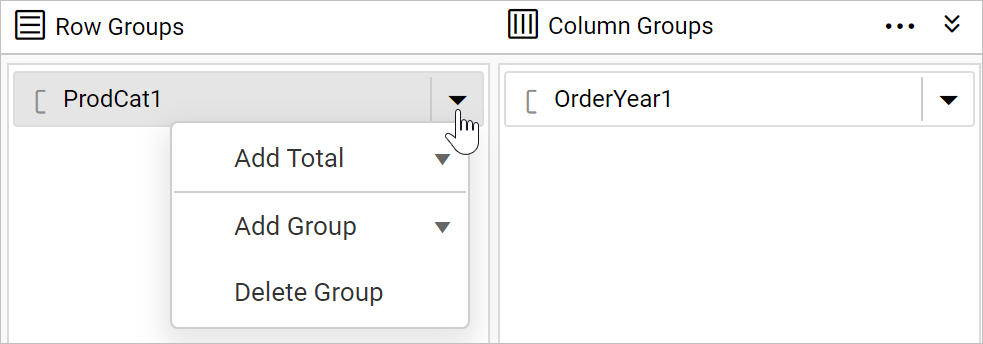
- From the context menu, click on
Child Group...option underAdd Groupcategory.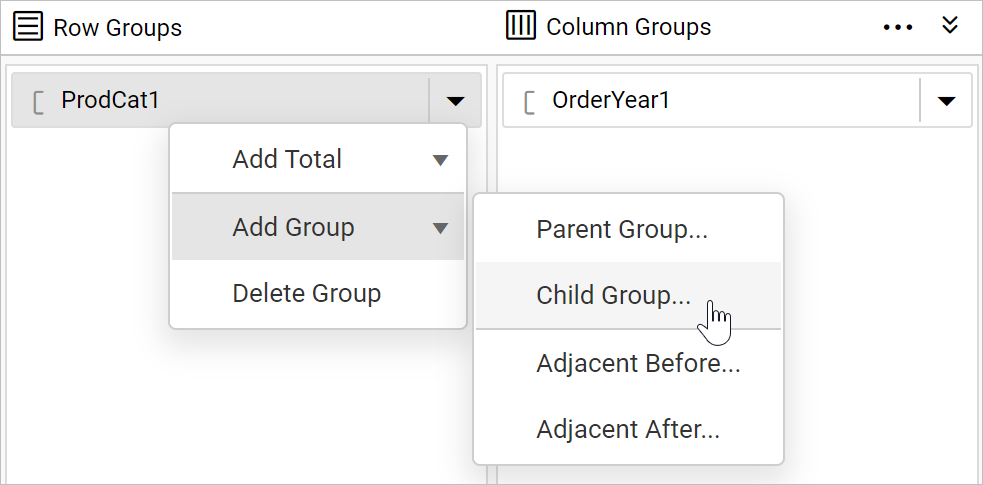
- Once you click on the
Child Groupoption, aTablix Groupdialog will be opened to configure the grouping.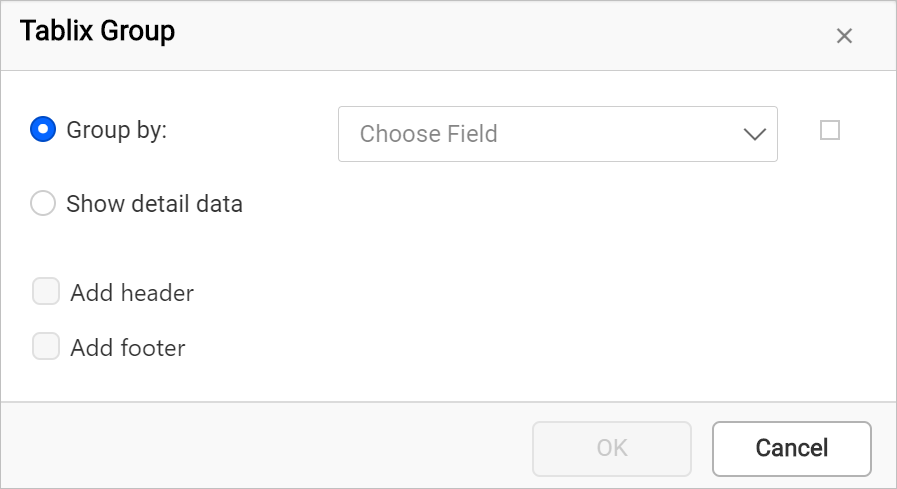
- Here,
SubCatfield is chosen as child row group in tablix data region. Click on theOKbutton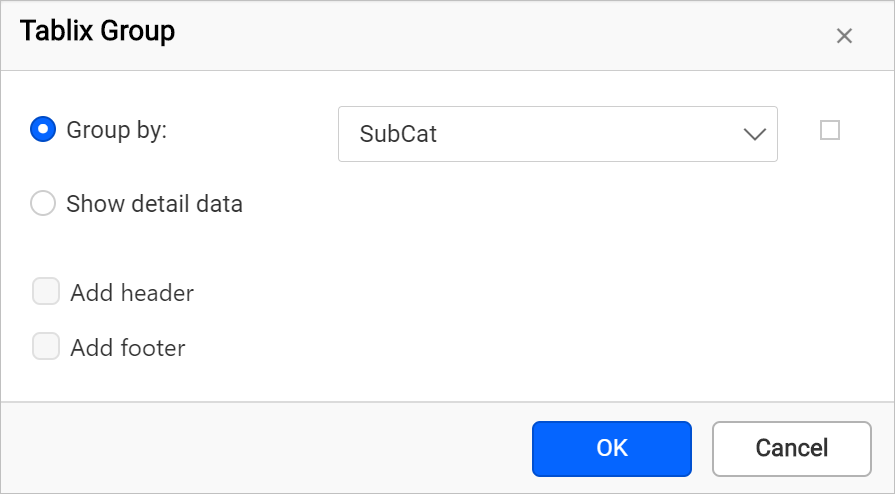
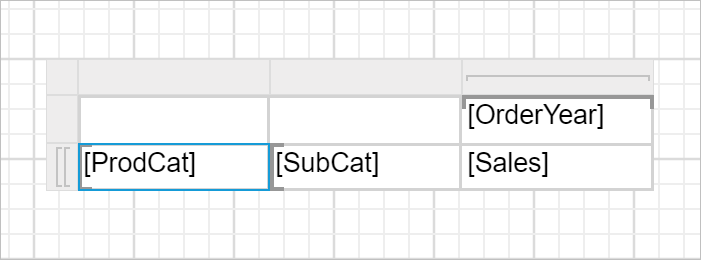
Now, the matrix design will look like below.
Add child column group
- In the
Column Groupspane, open the group menu inOrderYear1group field.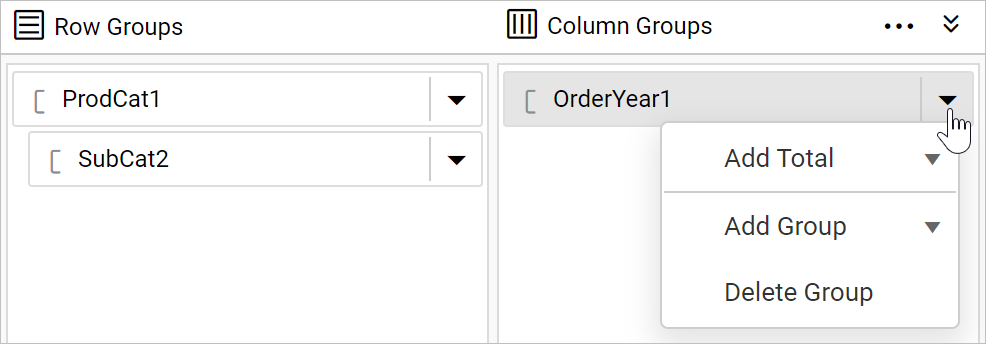
- From the context menu, click on
Child Group...option underAdd Groupcategory.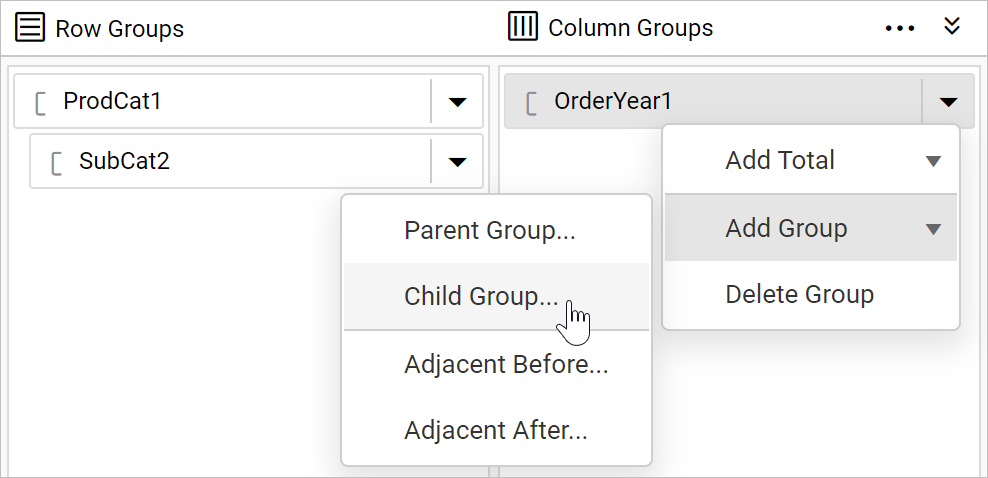
- Once you click on the
Child Groupoption, aTablix Groupdialog will be opened to configure the grouping. - Here,
OrderQtrfield is chosen as child column group in tablix data region. Click on theOKbutton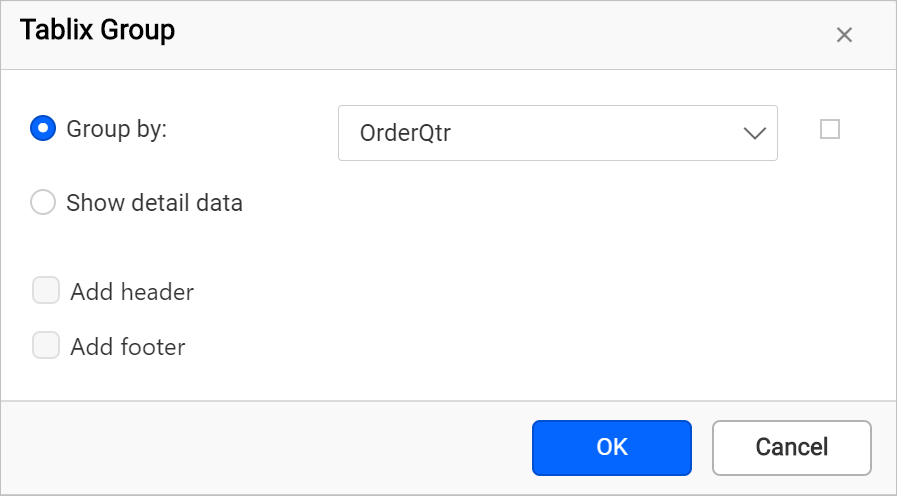
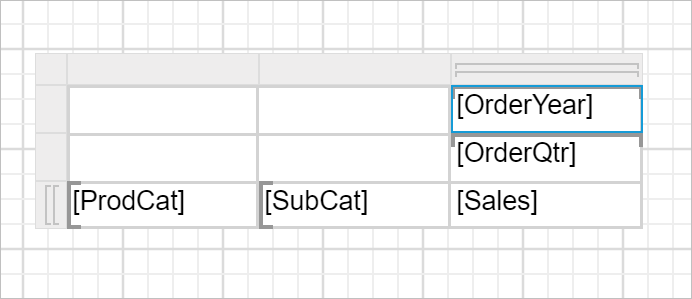
Now, the matrix design will look like below.
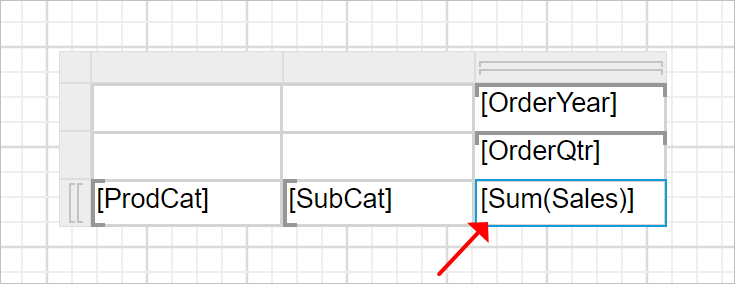
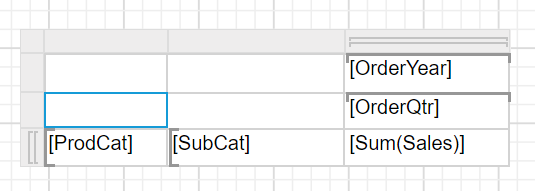
Calculate a summary
Now, a matrix report is created with row groups and column groups. To calculate the total sales amount for each product category, refer Assign expression in cell section and assign the =Sum(Fields!Sales.Value) expression to the last cell in third row of the matrix design as shown below.
To set expression in matrix cell, refer Assign or edit expression into table cell section.
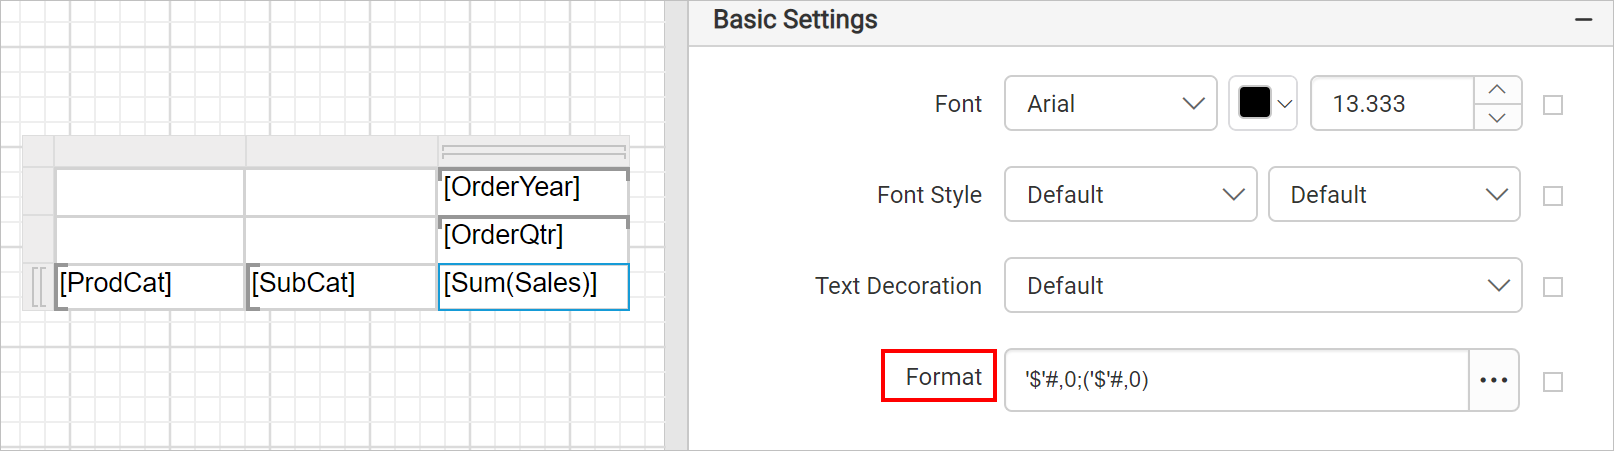
Format data
By default, the summary data for the Sales field displays a general number. To format the Sales field to display the number as currency, set the format for Sales field cell using the Format property.
Change width or height
The matrix report item expands horizontally as well as vertically. You can resize rows and columns to display the data without wrapping. To resize rows and column in matrix data region, refer Resize tablix data region. Here, the width of columns in matrix design is resized to minimum required width as shown below.
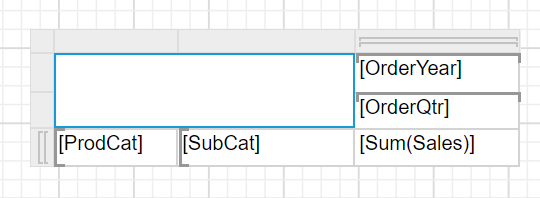
Merge matrix cells
After adding row and column groups, corner cells are created in the matrix design. You can use the corner cell to display any label content or data. The number of corner cell in a matrix design is based on the number of row and column groups in the matrix. In the above matrix design, it has four cells in its corner area. The cells are arranged in two rows and two columns. The four cells are not used in this report and it can be merged as one. To merge the corner cells, refer Merge cells in corner area
Format matrix design
In the below design background color and font styles are changed in matrix cells to improvise the report design.
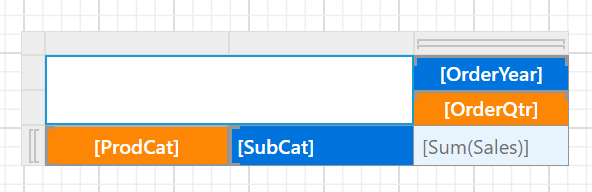
Refer the Cell Properties to style the matrix cell.
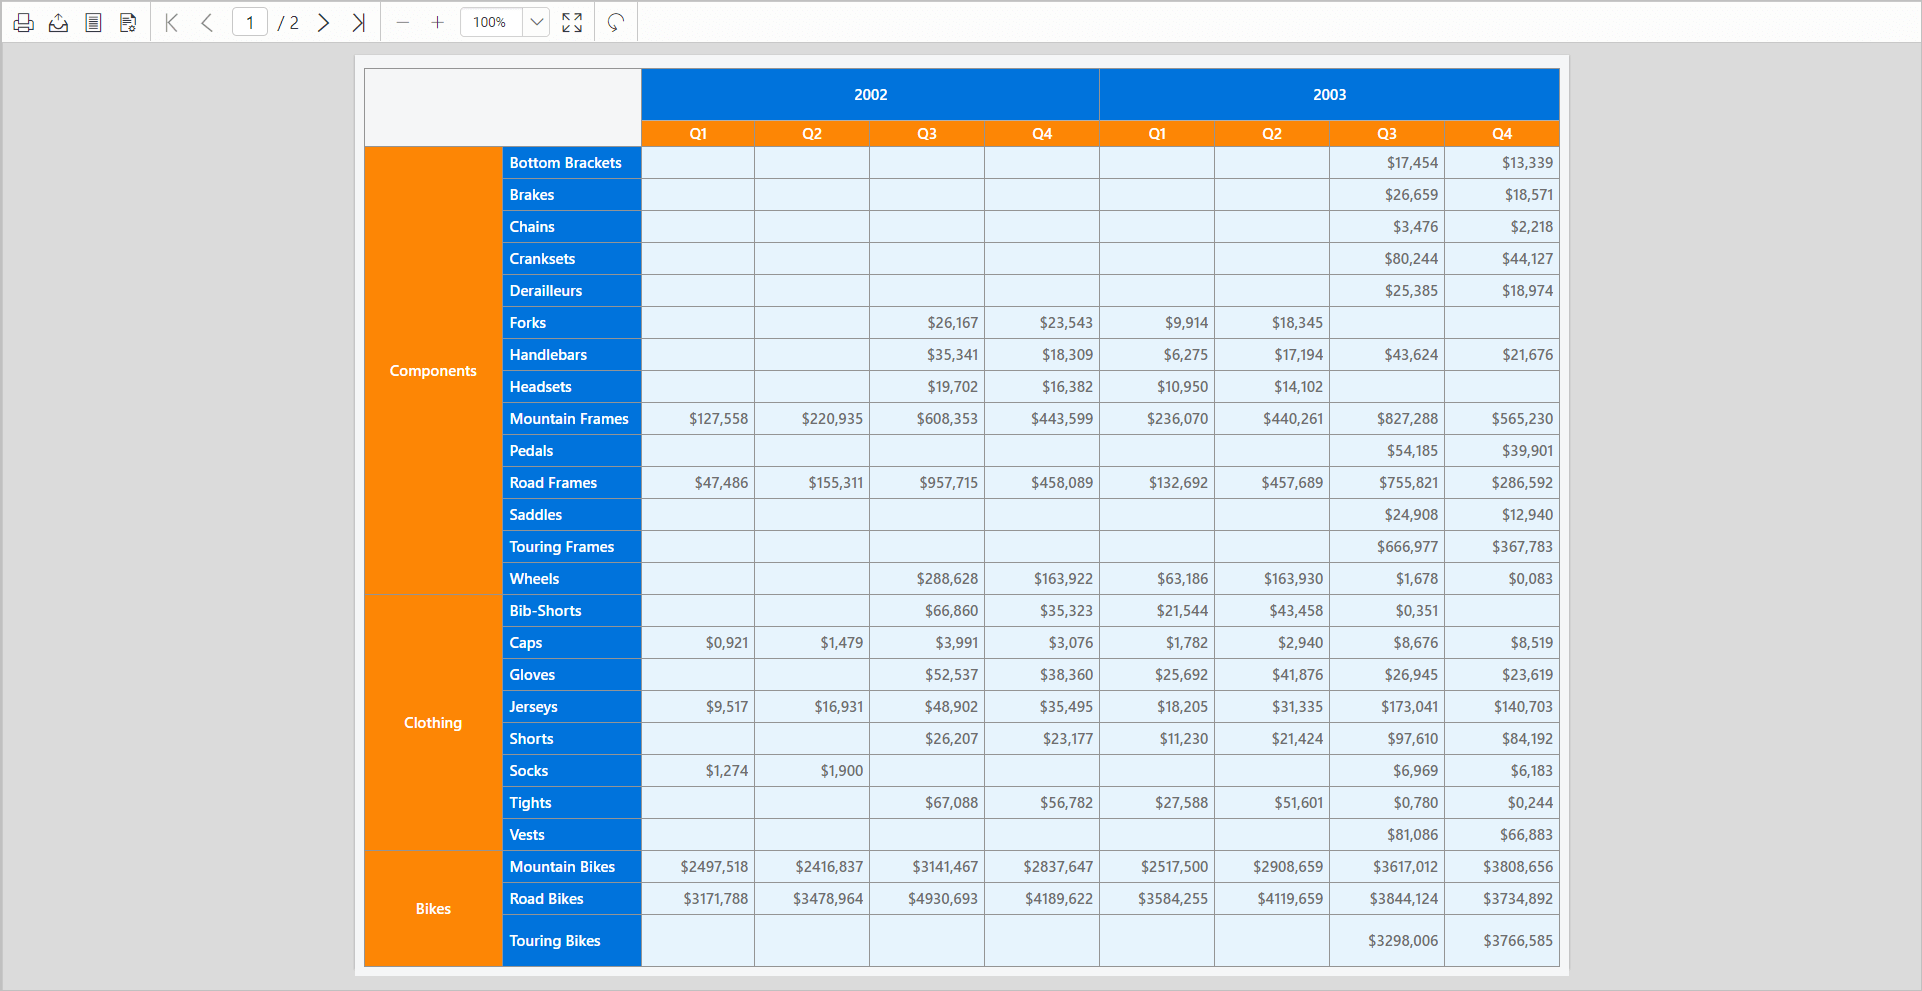
Report preview
On report preview, the yearly sales report of a company will be displayed like below,
Download the above report design from link.